

 photo by abbey*christine
Monitoring PPC account performance can be one of the most time consuming aspects of paid search management…. but it doesn’t have to be! With a little extra effort upfront, you can create auto-generated reports that will give you the data you need to know to ensure performance is on target or to make you aware of performance issues before it’s too late.
This article will provide you with a quick and proven method by which you can:
- Keep tabs on overall performance and KPIs
- Identify performance issues
- Identify areas of high performance
Failing to identify performance issues can be a problem for obvious reasons. However, failing to identify areas of high performance can be just as critical. If a campaign or ad group is performing well, but it is being limited by budget or ad position, you may be leaving conversions on the table.
Labels
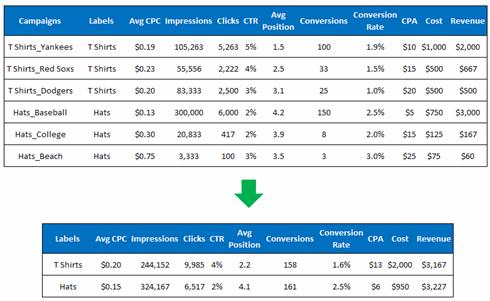
Labels are a feature in AdWords that allow you to group campaigns, ad groups, or ad copy into meaningful categories. Labels are helpful because they allow you to classify your account into categories for reporting and analysis purposes.
For example, let’s say you are a retailer selling t-shirts and hats online. You would like to monitor how hats perform vs. t-shirts. You have multiple campaigns for t-shirts and multiple campaigns for hats. Labels aggregate the data for you, saving a ton of time.
Campaign labels are shown in this example. They can be applied to ad groups and ad copy, as well.
If you have not thought about utilizing labels before, now is a great time to get started! Once you have added labels, you can easily setup reports that utilize them. This eliminates the need to subtotal, or use pivot tables to simplify the exported data.
Creating Your Report Template
When creating your report template, I find it best to group your report data into separate sheets. If you check the settings within your search management platform, you should be able to create a single report with multiple tabs. This is a great feature that can save you a lot of time (this allows you to combine multiple reports into one)! The section below should be used as a checklist for creating your report. I will explain each tab in more detail later in the article.
Your report should include all the primary search metrics such as Clicks, Impressions, CTR, along with any metrics you use for that account, such as CPA, or ROAS etc.
Tab 1
Overall Account Performance (time frame – by day)
- Month to date
- Previous month
- Current month – Last year
Tab 2
Keyword Category (Labels) Performance (time frame – summary)
- Month to date
- Previous month
- Current month – Last year
Tab 3
Keyword Category (Labels) Spend – Last 30 Days (time frame – by day)
Tab 4
Keyword Performance
- Month to date
- Previous month
- Current month – Last year
Once you have created your report with the following metrics and tabs, save it as a template. Also schedule your report so it is sent to you on a recurring basis (depending on what makes sense for you). I personally like this report to run each day so I always have the information handy.
Using the Data
Now that you have created and scheduled your report template, you have done the hard work! You now have the information you need to make accurate optimizations at your finger tips! Depending on what is going on with your account at the time, you can choose how much of the report you need to use.
These are some key takeaways/tips in regards to the different tabs.
Tab 1 - Overall Account Performance (time frame – by day)
How is the account performing on a hole by day?
- This allows you to check overall performance each morning and identify any big account issue right away.
- Also you should compare the current time period with last month and last year. Are you spending more or less than last year? Are you generating more or less revenue than last year? What’s happening with CTR and position?
Tab 2 - Keyword Category Performance (Time Frame – Summary)
How are the keyword categories performing overall vs. last month and last year?
- This is a great reference point to check spend on Brand vs. your other keyword categories.
- Has spend dropped for one of your top categories due to position changes? Is the account performing well because you increased the percentage of spend on Brand terms?
- If you have a specific spend strategy among the keyword categories, are you following it?
Tab 3 – Daily Keyword Category Spend (last 30 days)
- This is one of the most helpful tabs of the report.
- If you simply add a filter to the report, you can filter by the different keyword categories and evaluate the performance trends for the last 30 days by day. I find that it is really helpful to be able to quickly run through each keyword category and see how performance has fluctuated over the last 30 days.
Tab 4 – Keyword Performance
- This is something you might not have to look at every day, but having it handy can be really helpful. This is also one of the best ways to pinpoint an issue really quickly.
- At this level you want to compare how your top volume keywords are performing vs. last month, or last year.
Optional Analysis
If further analysis is required, there are a couple of other areas you can check quickly without dedicating large amounts of time.
Quality Score
It’s a good idea to have an understanding for the quality score of your top volume terms. To get a quick sense of quality score you can easily run a report.
- Do my top brand terms have really high quality scores? Most brand terms should have 8 to 10 as a quality score. Especially exact match terms.
- If you have a low quality score for a keyword that is highly related to your business/products you should try to understand what might be causing this. Can you develop more relevant ad copy, or Search Query Mine to add additional negatives?
Ad Copy
- One way to get a very quick read on ad copy is to look at your top performing keywords. Of the top 25 or so, what different keyword categories or ad groups are represented? For each of those top categories or ad groups, you should have custom ad copy that reflects that keyword category with appropriate messaging in the headline and body text. Also make sure your destination URL’s for those categories takes the user to the most relevant page of your website.
Your New Performance Monitoring Technique
Now that you have created your shiny new automated report, the only thing left to do is use it! Also since you no longer have to run these reports on an ad hoc basis, you can use the time you save to focus on new and exciting paid search endeavors!
COMMENTS