

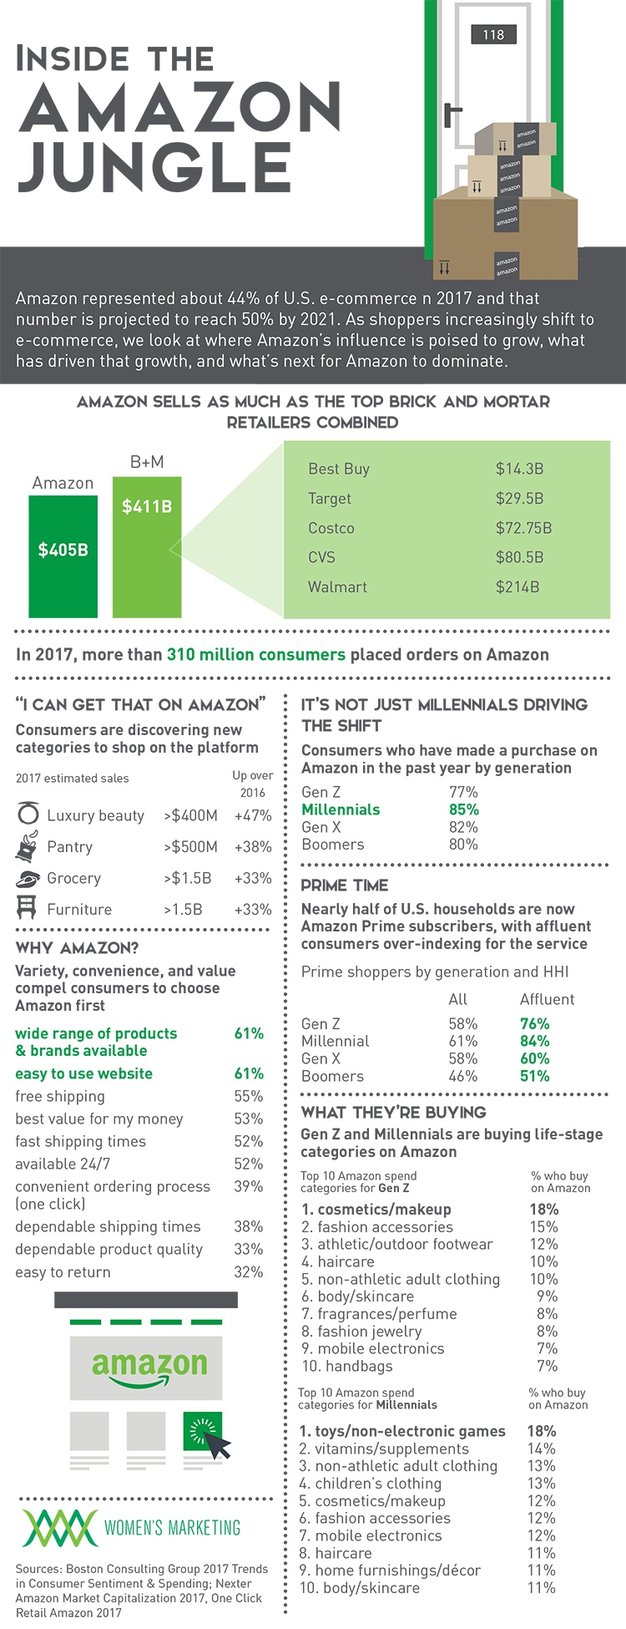
In 2017, it was estimated that Amazon represented 44% of U.S. e-commerce—and that number is projected to reach 50% by 2021. As shoppers increasingly shift to e-commerce, our infographic reveals where Amazon’s influence is poised to grow.
Amazon sells as much as the top brick and mortar retailers combined
In 2017, more than 310 million consumers placed orders on Amazon
Amazon Vs. top brick and mortar retailers
$405B Amazon Other retailers $411B
- It’s Not Just Millennials Driving the Shift
Consumers who have made a purchase on Amazon in the past year by generation
Gen Z 77%
Millennials 85%
Gen X 82%
Boomers 80%
The Amazon threat is too big to ignore. Contact us to learn how Women's Marketing's suite of Amazon marketing services helps brands stand out and win on the platform.

COMMENTS