

In navigating our clients on Amazon throughout the pandemic—from shipping delays in March to a late Prime Day in October—my focus has been on business goals and overcoming major changes. Prime Day jumpstarted Amazon’s Q4, and the momentum is only building. Over the 48 hours of Prime Day, our clients saw an average 3.7x lift, driven by an increase in ad support and enticing promotions. We will now continue driving business on Amazon throughout the holidays, using many of the best practices that proved effective during Prime Day. Two things are clear as we look to the holidays and into 2021: consumer reliance on Amazon has skyrocketed, and the brands that employ a savvy external traffic-driving strategy, in addition to sound on-platform initiatives, will capitalize.
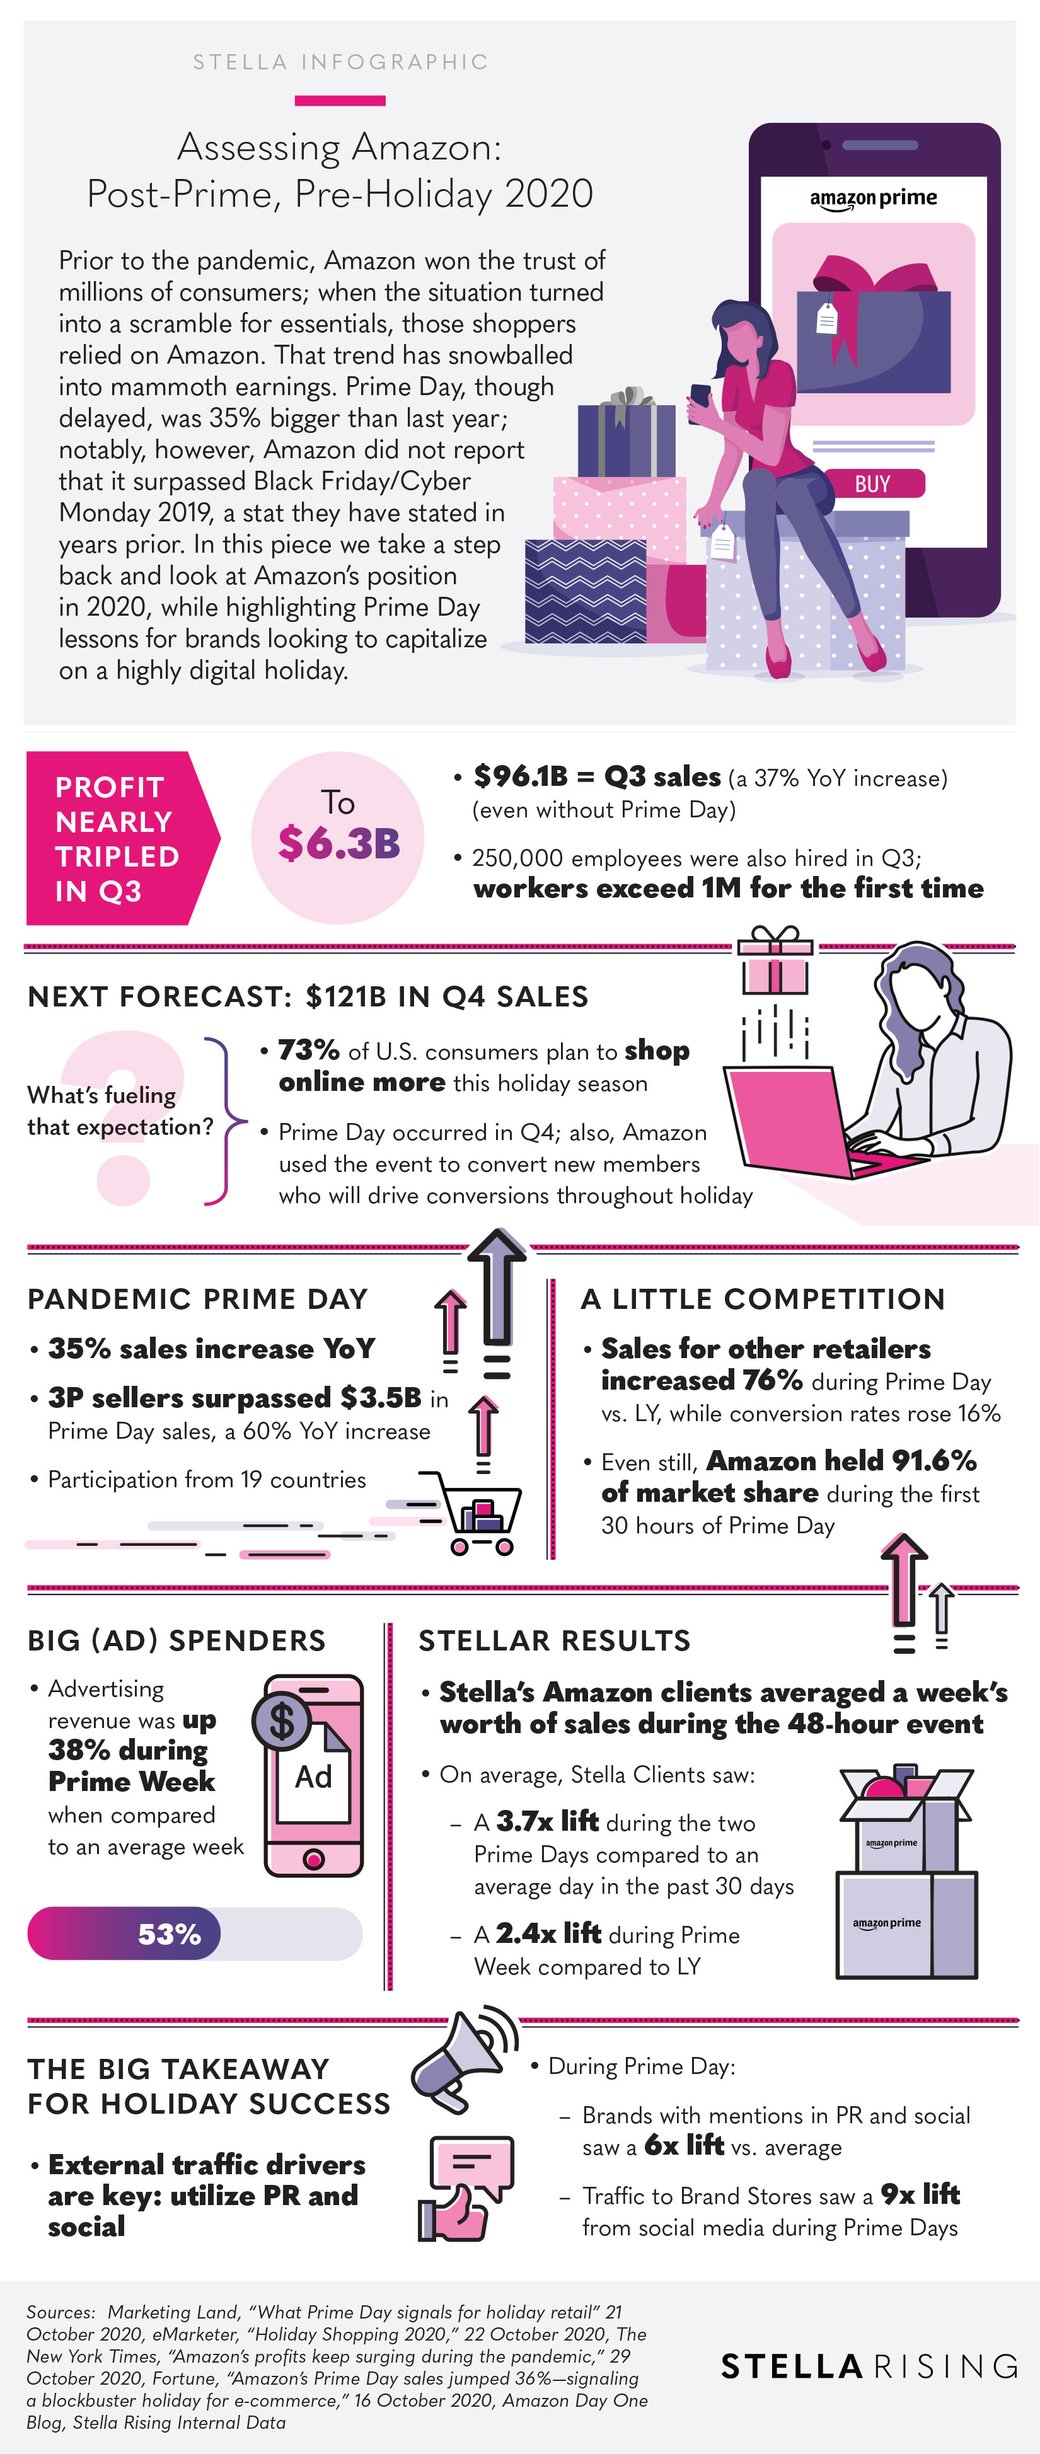
ASSESSING AMAZON, Q4 2020: WHAT YOU NEED TO KNOW
-
- Profit nearly tripled in Q3, to $6.3B
- Even without a Prime Day, Q3 sales increased 37% YoY
- Amazon forecasts $121B in Q4 sales, driven by the fact that:
- 73% of U.S. consumers plan to shop online more this holiday season
- Prime Day occurred in Q4
- Prime Day sales increased 35% vs. LY, while Amazon’s competitors were successful, too: sales for other retailers increased 76% during Prime Day vs. LY, while conversion rates rose 16%
- The big takeaway for holiday success: external traffic drivers are key: utilize Press, PR, and social
- During Prime Day:
- Brands with mentions in PR and Social saw a 6x lift vs. average
- Traffic to Brand Stores saw a 9x lift from social media during Prime Days
- During Prime Day:
At Stella Rising, we are well-versed in ecommerce, marketplaces, and brick and mortar retail. Connect with us to strengthen your Amazon strategy.
COMMENTS