

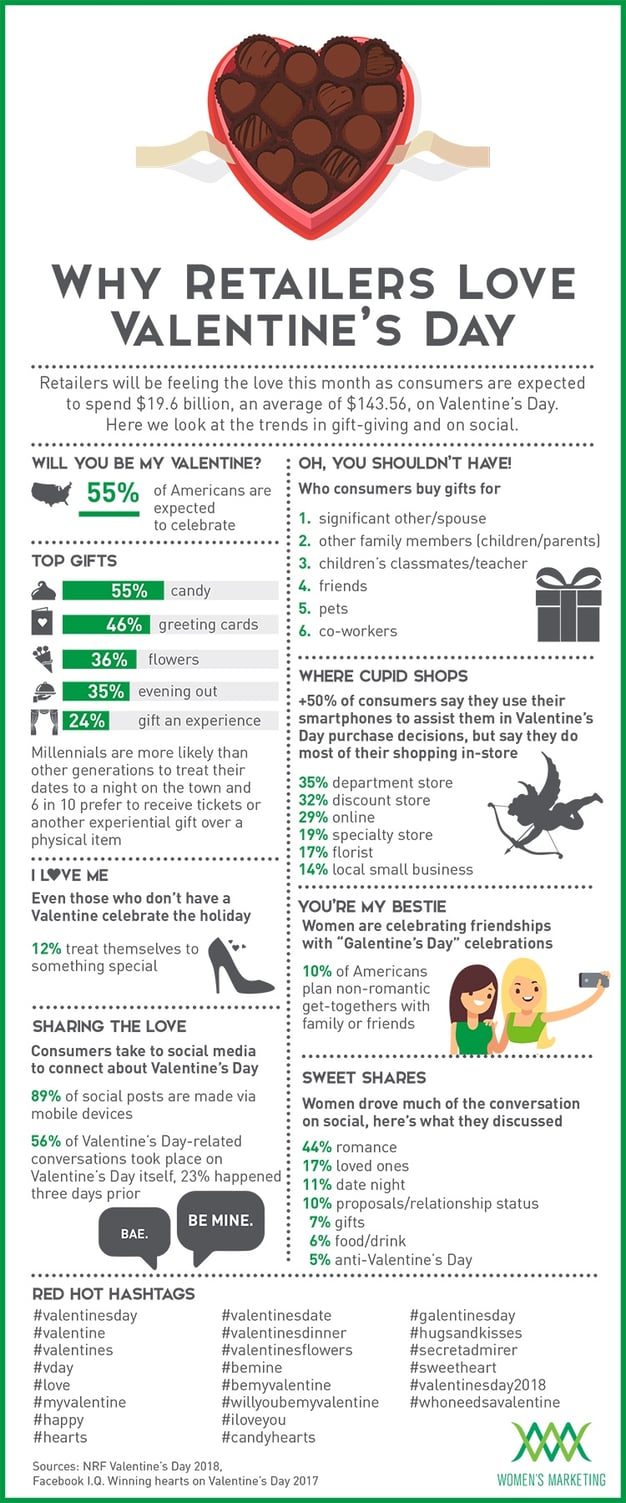
Retailers will be feeling the love this month as consumers are expected to spend $19.6 billion, an average of $143.56 per shopper, on Valentine’s Day. In our infographic, we look at the trends in gift-giving and on social media.
Will You Be My Valentine?
55% of Americans are expected to celebrate
Top Valentine's Day Gifts
55% candy
46% greeting cards
36% flowers
35% evening out
24% gift an experience
Millennials are more likely than other generations to treat their dates to a night on the town and 6 in 10 prefer to receive tickets or another experiential gift over a physical item.
Interested in learning more about consumer trends? Contact Women's Marketing to learn how we can help your brand grow.

COMMENTS